Since I rely heavily on the Zalando Spilo image as Postgres setup in my Kubernetes Homelab, I wanted to have those WAL-G backups that I make also within my Prometheus / Grafana setup. I had a look on existing solutions and found only but one which is no longer actively maintained as it seems. So I took this Prometheus WAL-G metric exporter written in Python, and made it working for me. I want to show you, how I use it as a sidecar on my Spilo Postgres pods and what is the outcome of it.
Disclaimer first: My wal-g-exporter has its roots in the camptocamp/wal-g-prometheus-exporter project. I took both the idea and quite some amount of code from there. Since this project hasn’t been contributed in quite some time now and I had a different strategy on how to write code, I decided to start over and take the code as a basis. So, many kudos to camptocamp.
With that out of the way, I want to write some words on the motivation of “my” Prometheus exporter. It has to play nice with the Zalando Spilo container image which is by default deployed by the Zalando Postgres Operator. Both of which I use in my home setup. At the current time, it’s more or less mandatory to use Spilo cause the of the way the image is built. It relies within the entrypoint to have an envdir under /run/etc/wal-e.d/env. This is the default behavior how Spilo stored it’s WAL-G environment variable configuration and I rely on this folder to get populated by Spilo. This may change in the future, so that wal-g-exporter is more of use in general usecases with Postgres.
You can follow along my project and all of the source code in my wal-g-exporter Github repository. I will use the container image (also part of the named repository) in the following version: ghcr.io/thedatabaseme/wal-g-exporter:0.1.0.
The following example(s) require to have the Zalando Postgres Operator or at least Spilo pods setup on your Kubernetes cluster. If you haven’t done so, read this article first and come back again later. The same applies for having WAL-G backups configured in your setup, if you need guidance, read here. The wal-g-exporter is compatible starting with Postgres 10 as far as I could have tested it. So let’s get into business shall we? First I share with you a quite default postgresql CRD manifest. Applying this to your cluster with a running Zalando Postgres Operator will create yourself a 3 node Postgres cluster.
apiVersion: "acid.zalan.do/v1"
kind: postgresql
metadata:
  name: postgres-demo-cluster
  namespace: postgres
spec:
  teamId: "postgres"
  volume:
    size: 5Gi
  numberOfInstances: 3
  users:
    demouser:  # database owner
    - superuser
    - createdb
  databases:
    demo: demouser  # dbname: owner
  postgresql:
    version: "14"
Now we take this manifest, and add the following highlighted lines to it. This will lead the Zalando Operator to rebuild the Postgres pods with a wal-g-exporter container running as a sidecar in the pod.
apiVersion: "acid.zalan.do/v1"
kind: postgresql
metadata:
  name: postgres-demo-cluster
  namespace: postgres
spec:
  teamId: "postgres"
  volume:
    size: 2Gi
  numberOfInstances: 3
  users:
    demouser:  # database owner
    - superuser
    - createdb
  databases:
    demo: demouser  # dbname: owner
  postgresql:
    version: "14"
  sidecars:
    - name: "backup-exporter"
      image: "ghcr.io/thedatabaseme/wal-g-exporter:0.1.0"
      env:
        - name: PGHOST
          value: 127.0.0.1
        - name: PGPORT
          value: "5432"
        - name: PGPASSWORD
          valueFrom:
            secretKeyRef:
              key: password
              name: postgres.postgres-demo-cluster.credentials.postgresql.acid.zalan.do
        - name: PGUSER
          valueFrom:
            secretKeyRef:
              key: username
              name: postgres.postgres-demo-cluster.credentials.postgresql.acid.zalan.do
      ports:
        - name: backup-exporter
          containerPort: 9351
          protocol: TCP
  additionalVolumes:
  - mountPath: /run/etc
    name: walg
    targetContainers:
    - postgres
    - backup-exporter
    volumeSource:
      emptyDir: {}
Let’s talk what we’ve done here. The postgresql CRD allows you to specify one or many sidecar containers to be configured within the CRD. This is what we do under the sidecar section. We give the child a name and specify which container image we want to use. Starting on line 23, we begin to configure the environment varaibles which configure wal-g-exporter. We need to tell it on which host, with which user and with which password it should connect to the Postgres database. A complete list of all configuration options can be found in the Github repository README.md.
Instead of hard coding the username and password environment variable values, we reference on a Secret that the Zalando Postgres Operator creates for every cluster it manages. So we use the postgres user and it’s password to connect to the database in this example. This is probably not what you want in production use, probably you will have configured a monitoring user or similar.
Starting in line 37 we specify which port the container exposes the metrics on (this is also the default port wal-g-exporter uses).
One very important step we do beginning at line 41. There we specify a volume, that both the actual Postgres container and our wal-g-exporter will share. Spilo will populate it’s given WAL-G backup configuration in this envdir and we use it in the wal-g-exporter. Within here is the actual backup target configuration. So on which S3 bucket the backups should be stored, with which credentials and so on. Since the wal-g-exporter uses also WAL-G to get information from the S3 bucket and to run backup validations, we need this information as well.
So let’s apply the manifest and wait for the result. You should see 3 pods with 2 containers running after a while. If you’ve configured everything properly, you should see something like the following log output of the wal-g-exporter.
2023-05-07 14:39:48,919 - Startup...
2023-05-07 14:39:48,919 - My PID is: 9
2023-05-07 14:39:48,920 - Reading environment configuration
2023-05-07 14:39:48,922 - Webserver started on port 9351
2023-05-07 14:39:48,922 - PGHOST 127.0.0.1
2023-05-07 14:39:48,922 - PGUSER postgres
2023-05-07 14:39:48,922 - PGDATABASE postgres
2023-05-07 14:39:48,922 - SSLMODE require
2023-05-07 14:39:48,922 - Starting exporter...
2023-05-07 14:40:48,994 - Is NOT in recovery mode? True
2023-05-07 14:40:48,994 - Connected to primary database
2023-05-07 14:40:48,994 - Evaluating wal-g backups...
2023-05-07 14:40:48,994 - Updating basebackup metrics...
2023-05-07 14:40:49,038 - 2 basebackups found (first: 2023-05-07T14:27:01.457963Z, last: 2023-05-07T14:40:46.219994Z)
2023-05-07 14:40:49,040 - Last basebackup duration: 2.565335988998413
2023-05-07 14:40:49,040 - Finished updating basebackup metrics...
2023-05-07 14:40:49,040 - Updating WAL archive metrics...
2023-05-07 14:40:49,118 - WAL integrity status is: OK
2023-05-07 14:40:49,118 - Found 6 WAL archives in 2 timelines, 0 WAL archives missing
2023-05-07 14:40:49,118 - Finished updating WAL archive metrics...
2023-05-07 14:40:49,118 - Updating S3 disk usage...
2023-05-07 14:40:49,187 - S3 diskusage in bytes: 17127314
2023-05-07 14:40:49,187 - Finished updating S3 metrics...
2023-05-07 14:40:49,187 - All metrics collected. Waiting for next update cycle...
Here you can see one of the nice features of wal-g-exporter. It is cluster aware. So when having multiple replicas on a Patroni cluster (which Spilo uses), he will get aware of this and only collects metrics on the primary cluster node. When a failover occurs, wal-g-exporter will also recognize this in the next loop and will no longer export any metrics. This makes it easier later in Prometheus and Grafana to rely on only one metric source for every cluster.
It’s time now to check for those metrics. We do a port forward on port 9351 and check with a webbrowser for http://localhost:9351. Something similar like the following should be the result (reducted for readability):
walg_basebackup_count 13.0
# HELP walg_oldest_basebackup oldest full backup
# TYPE walg_oldest_basebackup gauge
walg_oldest_basebackup 1.683028802567382e+09
# HELP walg_newest_basebackup newest full backup
# TYPE walg_newest_basebackup gauge
walg_newest_basebackup 1.683469220761307e+09
# HELP walg_last_basebackup_duration Duration of the last basebackup in seconds
# TYPE walg_last_basebackup_duration gauge
walg_last_basebackup_duration 93.50144410133362
# HELP walg_last_basebackup_throughput_bytes Show the throuhput in bytes per second for the last backup
# TYPE walg_last_basebackup_throughput_bytes gauge
walg_last_basebackup_throughput_bytes 2.494081757146613e+06
# HELP walg_wal_archive_count Archived WAL count
# TYPE walg_wal_archive_count gauge
walg_wal_archive_count 208.0
# HELP walg_wal_archive_missing_count Missing WAL count
# TYPE walg_wal_archive_missing_count gauge
walg_wal_archive_missing_count 0.0
# HELP walg_wal_integrity_status Overall WAL archive integrity status
# TYPE walg_wal_integrity_status gauge
walg_wal_integrity_status{status="OK"} 1.0
walg_wal_integrity_status{status="FAILURE"} 0.0
# HELP walg_last_upload Last upload of incremental or full backup
# TYPE walg_last_upload gauge
walg_last_upload{type="basebackup"} 1.683469220761307e+09
walg_last_upload{type="wal"} 1.683469313511702e+09
# HELP walg_s3_diskusage Usage of S3 storage in bytes
# TYPE walg_s3_diskusage gauge
walg_s3_diskusage 3.533035876e+09
Now we connect Prometheus to our exporter. In my case, I run a static target configuration and therefore I need the following service running on my Kubernetes cluster.
apiVersion: v1
kind: Service
metadata:
  name: postgres-demo-cluster-backup-exporter
  namespace: postgres
spec:
  selector:
    application: spilo
    cluster-name: postgres-demo-cluster
    spilo-role: master
  ports:
  - port: 9351
    targetPort: 9351
With the configuration added to my Prometheus configuration, we should see the target is getting scraped by Prometheus:

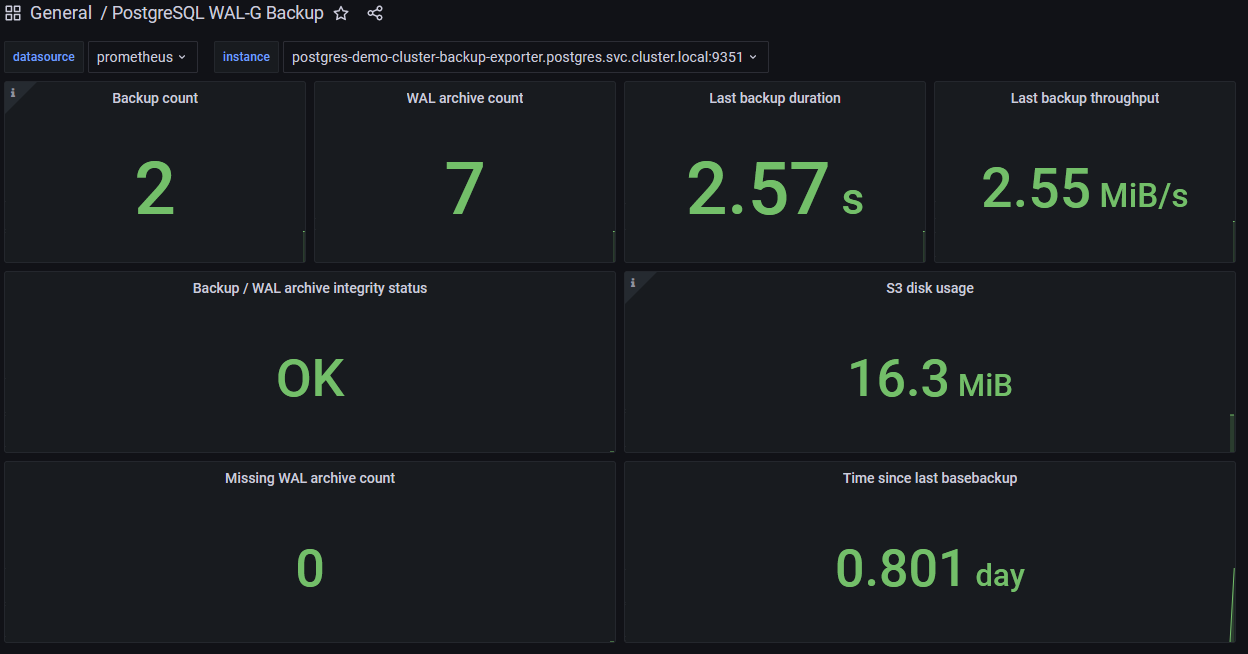
Finally I created a Grafana dashboard (you can find the json also in my Github repo here) which you can import in your Grafana:
With the metrics now collected and visible, you can also put some alerts on it as you desire. E.g. it would be a good option, to alert on the last basebackup be older than x days or obviously on the integrity status of your backups.
Philip